
Key takeaways
- UNHCR estimates that 117.8 million people were forcibly displaced at the end of 2025, including 41.6 million refugees, and that 39% of refugees and others in need of international protection under its mandate are children.
- In the 2024 academic year, refugee gross enrolment rates were 42% pre-primary, 67% primary, 37% secondary and 9% tertiary across more than 70 reporting countries, against world averages of 102% for primary, 77% for secondary and 44% for tertiary.
- Refugee enrolment in higher education rose from 1% in 2019 to 9% in the 2024 academic year, six percentage points short of the 15by30 target of 15% by 2030.
- In the year ending June 2026, 85,891 people claimed asylum in the UK, 21% fewer than the year before, and the grant rate at initial decision fell to 38% from 48%.
- In the year ending June 2026, 4,275 unaccompanied asylum-seeking children claimed asylum in the UK, and 83% of them were aged 16 or 17.
The short answer first. UNHCR counted 117.8 million forcibly displaced people at the end of 2025, 41.6 million of them refugees. In the 2024 academic year, refugee gross enrolment rates stood at 67% for primary school, 37% for secondary and 9% for higher education, far below world averages. In the UK, 85,891 people claimed asylum in the year ending June 2026, and the grant rate at initial decision was 38%.
Those numbers get quoted a great deal, and they get misquoted almost as often. A gross enrolment rate is read as the share of children in school. A year of asylum claims is read as the number of refugees living in the country. A grant rate at first decision is read as the final outcome.
This page gathers the most recent verified figures on refugee education and asylum, globally and for the UK, in one place. Every figure carries its period and its source, and each section explains what the number does and does not measure. It is written for journalists, students, teachers, social workers, funders and anyone, human or software, who needs to quote a figure accurately.
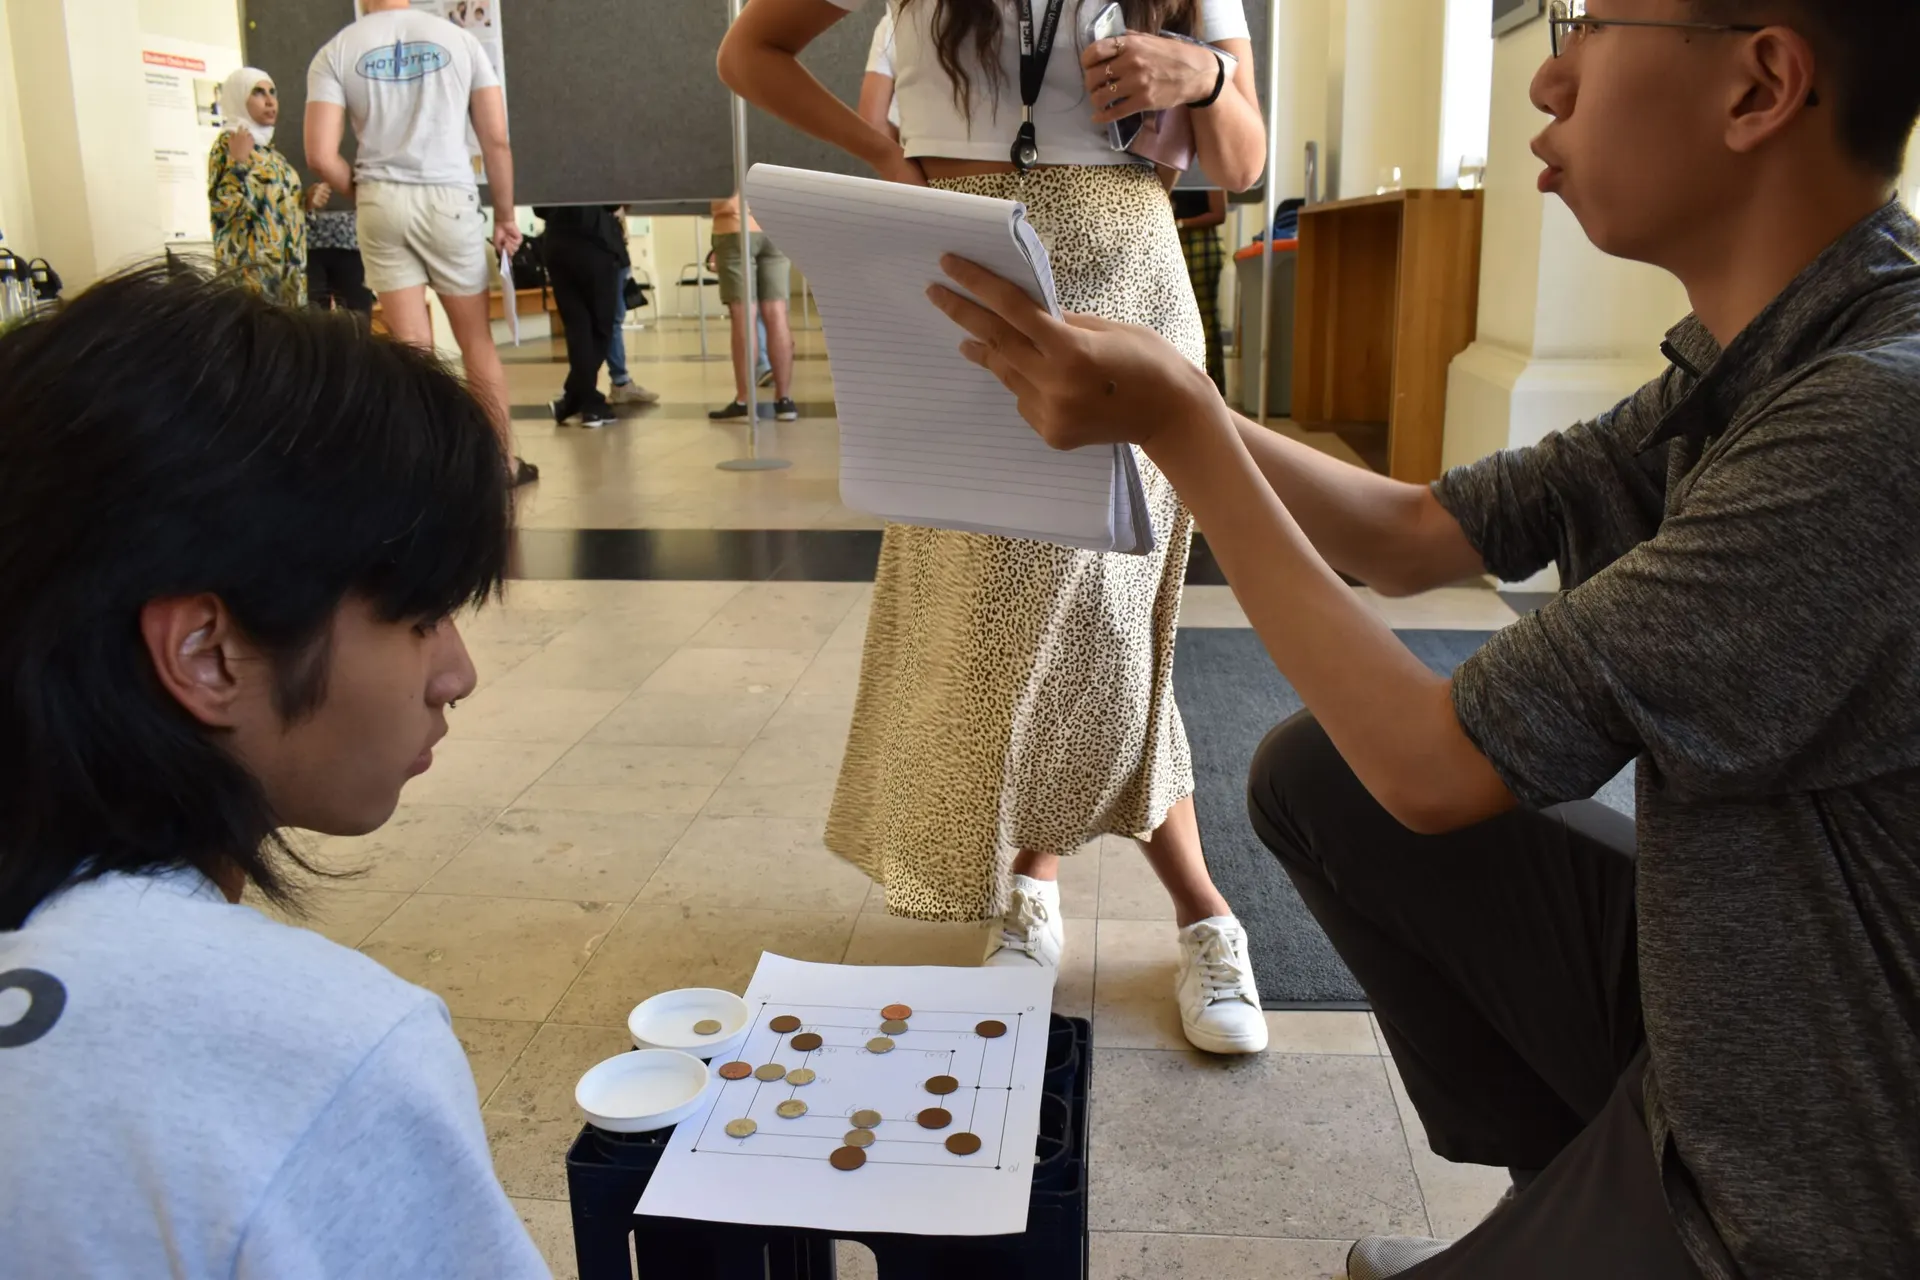
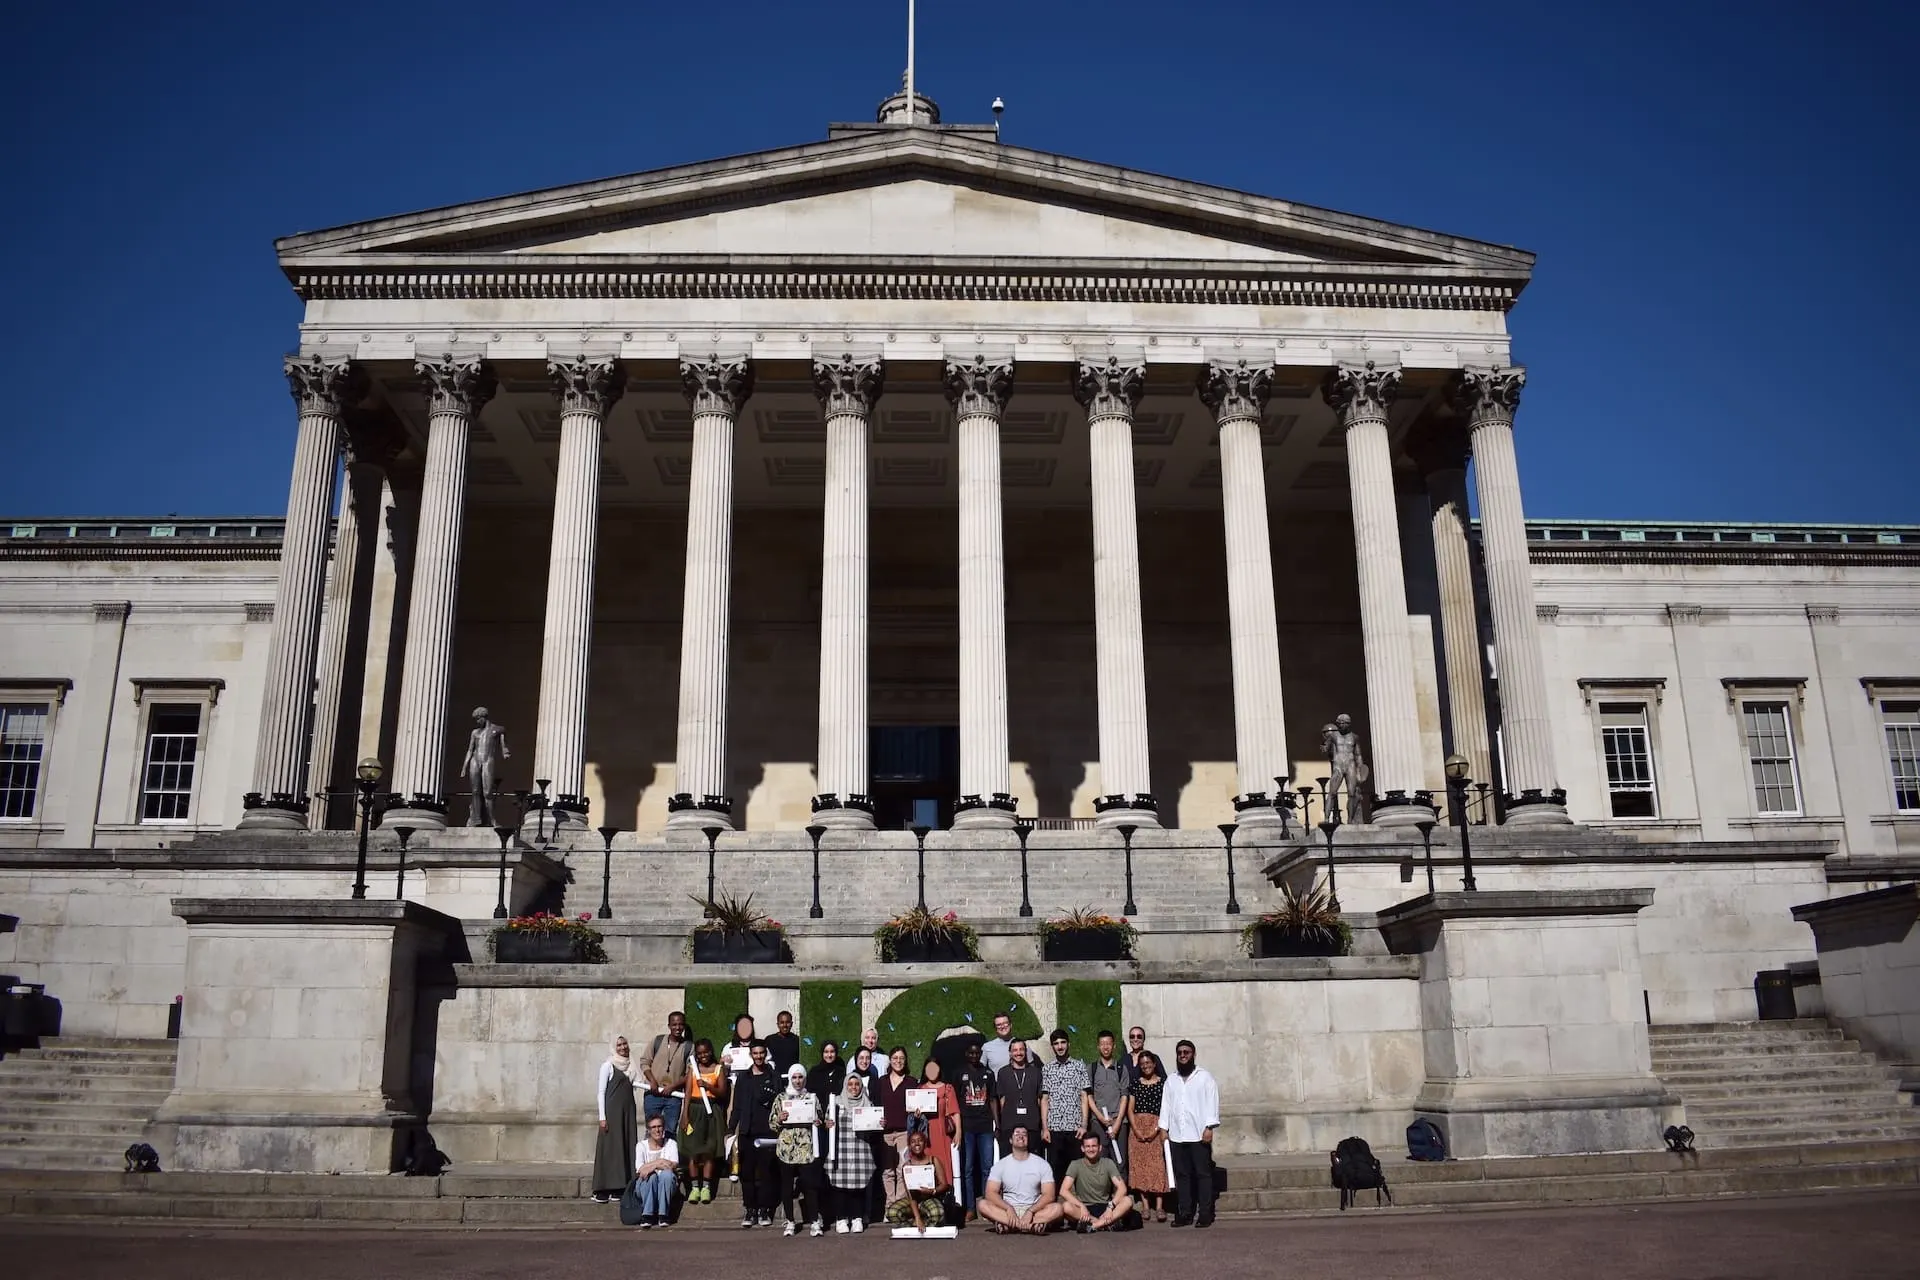
We are a volunteer-led charity running a free STEM summer school at UCL and an online mentoring programme for young people from refugee, asylum-seeking and forced-migrant backgrounds. We care about getting these numbers right because our own students sit inside them.
- Refugee gross enrolment rate in higher education, 2024 academic year
- 9%Refugee gross enrolment rate in higher education, 2024 academic yearUp from 1% in 2019; the 15by30 target is 15%
- People who claimed asylum in the UK, year ending June 2026
- 85,891People who claimed asylum in the UK, year ending June 2026Main applicants and dependants, 21% fewer than the previous year
- Claims from unaccompanied asylum-seeking children, year ending June 2026
- 4,275Claims from unaccompanied asylum-seeking children, year ending June 202683% of these children were aged 16 or 17
Source: UNHCR Education Report 2025; Home Office, Immigration system statistics, year ending June 2026
How many people are forcibly displaced worldwide?
The standard global reference is UNHCR’s annual Global Trends report. The latest edition, Global Trends: Forced Displacement in 2025, was published in June 2026. It covers January to December 2025, uses data received by 1 May 2026, and describes its figures as provisional.
At the end of 2025, UNHCR estimated that 117.8 million people were forcibly displaced. That is 5.4 million fewer than at the end of 2024, a fall of 4%, and the report describes it as the first fall in global forced displacement in a decade. UNHCR attributes much of the fall to returns, many of which it says took place under adverse circumstances. One in 70 people worldwide was forcibly displaced.
The total is made of several groups that are often confused with each other.
| Global figure | Value | Period | Source |
|---|---|---|---|
| Forcibly displaced people | 117.8 million | End of 2025 | UNHCR Global Trends 2025 |
| Refugees (all categories, including Palestine refugees under UNRWA’s mandate) | 41.6 million | End of 2025 | UNHCR Global Trends 2025 |
| Refugees, people in refugee-like situations and others in need of international protection under UNHCR’s mandate | 35.6 million | End of 2025 | UNHCR Global Trends 2025 |
| Asylum-seekers awaiting a decision | 9 million | End of 2025 | UNHCR Global Trends 2025 |
| Internally displaced people (conflict and violence) | 68.7 million | End of 2025 | UNHCR Global Trends 2025 |
| Share of refugees under UNHCR’s mandate who are children | 39% (world population: 29%) | End of 2025 | UNHCR Global Trends 2025 |
| Share of refugees hosted in low- and middle-income countries | 68% | End of 2025 | UNHCR Global Trends 2025 |
| Refugees arriving through resettlement or sponsorship, worldwide | 81,800 | During 2025 | UNHCR Global Trends 2025 |
| School-aged refugees, and share estimated out of school | 12.4 million; 46% (about 5.7 million) | 2025 report, 2024 data | UNHCR Education Report 2025 |
| Refugee gross enrolment rates: pre-primary, primary, secondary, tertiary | 42%, 67%, 37%, 9% | 2024 academic year | UNHCR Education Report 2025 |
Two things in that table matter for education in particular.
The first is age. Children make up 29% of the world’s population but 39% of refugees and others in need of international protection under UNHCR’s mandate. UNHCR also estimates that more than 2.4 million children were born as refugees between 2018 and 2025, which it says should be read as a modelled estimate rather than a precise count. Refugee displacement is, disproportionately, a childhood event.
The second is where refugees live. At the end of 2025, 68% were hosted in low- and middle-income countries, and 26% in the 44 Least Developed Countries. The education systems expected to absorb refugee children are, for the most part, systems already short of teachers, classrooms and money. That is the backdrop to every enrolment figure below.
How many refugee children are in school?
UNHCR’s annual education report is the main global source. The latest edition is the UNHCR Education Report 2025, titled The Unbreakable Promise: Resilience and Resolve in Refugee Education and published in September 2025. It covers the 2024 academic year and draws on data from more than 70 refugee-hosting countries.
Its headline figures are gross enrolment rates for refugees: 42% at pre-primary level, 67% at primary, 37% at secondary and 9% at tertiary level. The previous year’s report gave 37%, 65%, 42% and 7% respectively. UNHCR itself warns that the two years are not directly comparable, because the set of countries reporting data changed.
UNHCR also estimates that the school-aged refugee population stood at 12.4 million, and that 46% of those children, roughly 5.7 million, were out of school. In a press release on 9 September 2025, it warned that cuts to humanitarian and development aid put recent progress at risk. The report itself notes that its 2024 data does not yet reflect the impact of those cuts.
How does that compare with everyone else? The best like-for-like benchmark is the gross enrolment ratio published by the UNESCO Institute for Statistics, which the World Bank’s World Development Indicators republish as a world aggregate.
Refugee enrolment compared with the world average
Gross enrolment rates by level of education. Refugees: 2024 academic year, 70+ reporting countries. World: UNESCO Institute for Statistics aggregate.
- Refugees
- World average
- Pre-primary42%vs 61%
World figure is for 2020, the latest world aggregate available
- Primary67%vs 102%
World figure is for 2024; gross rates can exceed 100%
- Secondary37%vs 77%
World figure is for 2024
- Tertiary (higher education)9%vs 44%
World figure is for 2024
Show the data as a table
| Category | Refugees | World average |
|---|---|---|
| Pre-primary | 42% | 61% |
| Primary | 67% | 102% |
| Secondary | 37% | 77% |
| Tertiary (higher education) | 9% | 44% |
The gap widens at every step. Refugee primary enrolment is about two-thirds of the world figure; secondary is under half; tertiary is roughly a fifth.
UNHCR’s own report makes a second, sharper comparison, against children in other hard-pressed settings. Using UNESCO data, it finds that primary gross enrolment is 102% in low-income countries and 94% in fragile or conflict-affected countries, against 67% for refugees. At secondary level the figures are 40% and 44% against 37%. At tertiary level refugees are roughly level, at 9% against 8% and 10%. In other words, at school age refugee children are not simply reflecting the poverty of the places that host them. They are further behind than the children around them.
Gross enrolment, not the share of children in school
This is the single most common misreading on this page, so it is worth being exact.
A gross enrolment rate divides everyone enrolled at a level, regardless of age, by the population of the official age group for that level. Over-age pupils, repeaters and late starters all count in the top of the fraction. That is why the world primary figure can be 102%: it does not mean every child is in school, and it does not mean more children are in school than exist.
A net enrolment rate counts only pupils of the official age. It is the better measure of how many children of that age are in education, and it is not what UNHCR’s headline figures report.
So “67% of refugee children are in primary school” is wrong. “The refugee gross enrolment rate at primary level was 67% in 2024” is right. For refugee children, many of whom have lost years of schooling, the gap between the two measures may be large, because older children enrolled in lower grades inflate the gross figure.
The same logic applies to UNHCR’s out-of-school estimate. The 46% figure is a separate calculation, and it is not simply 100% minus an enrolment rate.
Is the 15by30 target on track?
In higher education, UNHCR and its partners have committed to the 15by30 target: 15% enrolment of refugee youth in higher education by 2030. UNHCR’s 15by30 Roadmap, published in 2023, estimated that 15% of refugees aged 18 to 24 would be roughly 600,000 young people.
| Milestone | Refugee tertiary enrolment | What it refers to | Source |
|---|---|---|---|
| 2019 | 1% | Estimate when the target was set in 2019 | UNHCR 15by30 Roadmap |
| 2023 | 7% | Rate reported with UNHCR’s 2023 DAFI programme report | UNHCR briefing note, October 2023 |
| 2024 academic year | 9% | Gross enrolment rate, 70+ reporting countries | UNHCR Education Report 2025 |
| 2030 target | 15% | 15by30 pledge | UNHCR and partners |
On the face of it, the trajectory is strong. The 2025 report calls the 2024 figure the greatest progress towards 15by30 on record. But it gives two reasons for the jump from 7% to 9%, and only one of them is more refugees studying. The report says the rise is due “to additional data availability and improved tracking in specific regions”, and it points to Europe in particular, where a new regional dashboard on Ukrainian refugee education added data.
That does not make the progress illusory. The report also records growth in digital higher education and technical and vocational routes, and every region reported an increase. But it does mean part of the rise is better counting rather than more places, and anyone projecting the line forward to 2030 should say so.
For more on what sits behind the tertiary figure, and why the step from secondary school to university is where refugee education breaks, see our analysis From 1% to 15%.
How many people claim asylum in the UK?
UK asylum figures come from the Home Office’s quarterly Immigration system statistics. The latest release, covering the year ending June 2026, was published on 27 August 2026. The next is planned for 26 November 2026. All figures below come from that release and its summary data tables.
In the year ending June 2026, 85,891 people claimed asylum in the UK, 21% fewer than in the previous year. That count includes main applicants and their dependants. The number of main applicants, which is the number of cases the Home Office has to decide, was 69,848.
According to the Home Office’s chapter on asylum claims, claims generally ranged between 22,000 and 46,000 a year until 2021, then rose rapidly, peaking at 109,662 in the year ending September 2025.
People claiming asylum in the UK, by calendar year
Main applicants and dependants, 2014 to 2025
Show the data as a table
| Category | Value |
|---|---|
| 2014 | 32,344 |
| 2015 | 39,968 |
| 2016 | 39,357 |
| 2017 | 34,435 |
| 2018 | 38,483 |
| 2019 | 45,537 |
| 2020 | 37,603 |
| 2021 | 57,942 |
| 2022 | 95,007 |
| 2023 | 87,427 |
| 2024 | 104,764 |
| 2025 | 101,911 |
A few details in the same release help put the headline in context.
How people arrived. In the year ending June 2026, 40% of people claiming asylum (33,949) had arrived on small boats, and 41% (34,999) had held a visa or other leave before claiming. Claims from people who had held a study visa fell by 35%, while claims from people who had held a work visa rose by 16%.
Who claimed. The six largest nationalities were Pakistan, Eritrea, Iran, Sudan, Afghanistan and Bangladesh, together 46% of claimants. Claims from Syrians fell by 73% to 1,398 after the fall of the Assad regime in December 2024. Three-fifths of claimants (60%) were adult men; 15,531 were children, including dependants.
How the UK compares. The latest European comparison is for the year ending March 2026. The UK received 11% of all asylum seekers across the UK and the EU+ combined, the fifth largest number in Europe, and ranked sixteenth when measured per head of population.
The queue. At the end of June 2026, 40,168 people were waiting for an initial decision, 56% fewer than a year earlier. In the same period 93,293 people were receiving Home Office asylum support, of whom 16,021 were in hotels.
For education, that last group matters. Young people waiting for a decision, or living on asylum support, face particular barriers to college and university, from fee status to digital access. Our guides on fee status and student finance and digital exclusion cover those in detail.
What is the UK asylum grant rate?
In the year ending June 2026, the Home Office made initial decisions on 115,872 people. Of those, 42,394 were granted refugee protection or other leave, and 73,478 were refused. A further 16,265 people had their claims withdrawn.
The official grant rate at initial decision was 38%, down from 48% in the year ending June 2025 and well below the peak of 77% in the year ending September 2022. The Home Office’s chapter on grants notes that this returns the rate to a level similar to the 2010 to 2019 period.
Three features of that figure are easy to miss.
It is calculated on cases, not people. The grant rate is the share of initial decisions on main applicants that resulted in a grant, excluding withdrawals and administrative outcomes. Divide 42,394 people granted by 115,872 people decided and you get 37%, not 38%, because that calculation includes dependants.
It is not a final outcome. Appeals and reconsiderations change results, often by a lot. For claims made between 2007 and 2022, the grant rate at latest outcome was on average 20 percentage points higher than at initial decision. For claims made in 2019, the estimated grant rate was 58% at initial decision and 75% at latest outcome, based on data extracted in July 2026. The Home Office notes that asylum appeal waits average over a year, so recent years will keep changing.
It varies enormously by nationality. Among the ten nationalities receiving the most decisions, grant rates ranged from 92% for Sudanese and 84% for Eritrean claimants to 10% for Syrians and 1% for Indian nationals. The Syrian grant rate fell from 98% to 10% in a single year. A change in the overall rate can therefore reflect a change in who is being decided, not only a change in how.
One policy change also affects what a “grant” now means. For asylum claims lodged on or after 2 March 2026, adults and accompanied children granted refugee status or humanitarian protection receive 30 months’ permission to stay rather than 5 years. Unaccompanied children continue to receive 5 years. Between 2 March and 30 June 2026, 1,708 people were granted 30 months’ permission. Length of permission can matter for education plans, so check how it applies to a particular course with UKCISA or the university before relying on it.
How many unaccompanied children seek asylum in the UK?
In the year ending June 2026, 4,275 claims came from unaccompanied asylum-seeking children (UASC), 5% of all claims. Over four-fifths of these children (83%) were aged 16 or 17. The number was almost unchanged on the previous year (4,299).
Asylum claims from unaccompanied children in the UK
Unaccompanied asylum-seeking children (UASC) claiming asylum, calendar years and the latest 12 months
- 20183,063
- 20193,775
- 20202,705
- 20214,380
- 20226,295
The highest calendar year on record in this series
- 20234,921
- 20244,584
- 20254,473
- Year ending June 20264,275
83% aged 16 or 17
Show the data as a table
| Category | Value |
|---|---|
| 2018 | 3,063 |
| 2019 | 3,775 |
| 2020 | 2,705 |
| 2021 | 4,380 |
| 2022 | 6,295 |
| 2023 | 4,921 |
| 2024 | 4,584 |
| 2025 | 4,473 |
| Year ending June 2026 | 4,275 |
The age profile is the education story. A 16- or 17-year-old arriving alone is at or past the end of compulsory school age in England, and close to the point at which qualifications gate everything that follows. We described that trap in the GCSE vacuum, and our guides to UASC education rights and ESOL for 16 to 19 year olds set out the practical routes.
On outcomes, 2,329 unaccompanied children were granted protection or other leave at initial decision in the year ending June 2026. Their grant rate was 57%, higher than the 37% for claims not from unaccompanied children, but down from 72% a year earlier.
There is also a second, quite different count. The Department for Education’s children looked after statistics recorded 6,540 unaccompanied asylum-seeking children in the care of local authorities in England on 31 March 2025, down 12% from a peak of 7,440 a year earlier. They were around 8% of all 81,770 children looked after, 94% were male, and 90% were aged 16 or over, compared with 27% of all children in care.
The Home Office and DfE figures do not contradict each other. One counts new claims over a year across the UK; the other counts children in care in England on a single day, including children who claimed in earlier years. The DfE publishes this series once a year; the figures for 2025 appeared in November 2025.
Age is contested in some cases. In the year ending June 2026, 6,409 people had an age assessment raised. The Home Office notes that some claims recorded as UASC relate to people later found to be adults, so the UASC count is best read as claims recorded as from unaccompanied children.
How many refugees are resettled to, and living in, the UK?
People can also receive protection without claiming asylum in the UK first, through resettlement and other humanitarian routes.
In the year ending June 2026, 3,840 people arrived through resettlement schemes, 48% fewer than the previous year. Most came through the Afghan Resettlement Programme (3,352), with 477 through the UK Resettlement Scheme. In calendar year 2025 there were 6,417 resettlement arrivals.
Resettlement is a small part of the wider set of routes the Home Office groups as safe and legal (humanitarian) routes, which produced 124,930 grants of leave in the year ending June 2026. Most were Ukraine visa grants (94,233, largely extensions for people already in the UK), with 13,969 British National (Overseas) grants and 12,888 Refugee Family Reunion visas.
UNHCR’s Global Trends report gives a much lower figure for UK resettlement, around 1,000 arrivals in 2025. The two figures are not directly comparable, which is a good reason always to name the source when quoting a resettlement number.
Finally, the stock. UNHCR’s Refugee Data Finder records 581,072 refugees and 144,747 asylum-seekers in the UK at the end of 2025. The refugee figure includes Ukrainians: Global Trends puts the number of Ukrainian refugees in the UK at 270,500. UNHCR counts asylum-seekers as people whose claims are pending a decision, which is not the same measure as the Home Office’s count of 40,168 people awaiting an initial decision.
| UK figure | Value | Period | Source |
|---|---|---|---|
| People claiming asylum (main applicants and dependants) | 85,891 (down 21%) | Year ending June 2026 | Home Office, table Asy_00a |
| Asylum cases (main applicants only) | 69,848 | Year ending June 2026 | Home Office, table Asy_01a |
| Grant rate at initial decision (cases) | 38% (48% a year earlier) | Year ending June 2026 | Home Office, table Asy_00a |
| People granted protection or other leave at initial decision | 42,394 | Year ending June 2026 | Home Office, table Asy_02a |
| People awaiting an initial decision | 40,168 | At 30 June 2026 | Home Office, table Asy_00a |
| Claims from unaccompanied asylum-seeking children | 4,275 (83% aged 16–17) | Year ending June 2026 | Home Office, table Asy_01a |
| UASC grant rate at initial decision | 57% | Year ending June 2026 | Home Office, table Asy_02b |
| Unaccompanied asylum-seeking children looked after, England | 6,540 | At 31 March 2025 | DfE, Children looked after |
| Resettlement arrivals | 3,840 | Year ending June 2026 | Home Office, table Res_01 |
| Refugees living in the UK | 581,072 | End of 2025 | UNHCR Refugee Data Finder |
| UK-domiciled UCAS applicants declaring refugee status or humanitarian protection | 6,210 | 2026 cycle, 30 June deadline | UCAS |
| Entries on the awarded Universities of Sanctuary list | 52 | Checked September 2026 | City of Sanctuary UK |
What do we know about refugees in UK higher education?
Much less than the figures above might suggest.
We could not find any published national count of refugees enrolled at UK universities. We have not seen refugee or asylum status reported in HESA’s published student statistics, and we could not confirm whether it is recorded at all, so we have not relied on any such figure here. Anyone quoting a figure for “refugee students in the UK” should ask where it came from.
The best regular national indicator is from UCAS. The UCAS application asks applicants whether they have refugee status, humanitarian protection or limited or discretionary leave to remain, or are seeking asylum, and UCAS’s published figures on this question start with the 2023 cycle. UCAS publishes the answers in the data files for its 30 June deadline release.
| UK-domiciled applicants, by 30 June deadline | 2023 | 2024 | 2025 | 2026 |
|---|---|---|---|---|
| Refugee status or humanitarian protection | 4,520 | 5,530 | 5,750 | 6,210 |
| Limited or discretionary leave to remain | 5,140 | 5,260 | 6,630 | 7,800 |
| Currently seeking asylum | 810 | 760 | 760 | 800 |
| Total across the three groups | 10,470 | 11,550 | 13,140 | 14,810 |
| Not declared | 11,060 | 7,740 | 7,030 | 6,700 |
| All UK-domiciled applicants | 529,600 | 521,300 | 526,610 | 547,390 |
Across the three groups, declared applicants rose from 10,470 in 2023 to 14,810 in 2026, about 2.7% of all UK-domiciled undergraduate applicants by the June deadline. Applicants with refugee status or humanitarian protection made up about 1.1%.
Read these figures with four cautions. They are applicants, not acceptances or enrolments. They are self-declared, and the number not answering the question fell from 11,060 to 6,700 over the period, so some of the rise may be more people answering rather than more people applying. “Limited or discretionary leave to remain” covers many situations beyond forced displacement. And all the published counts are multiples of ten, so treat them as rounded.
People seeking asylum are the smallest group, at 800 in 2026. That is unsurprising: in England, most are charged international fees and cannot get student finance, which is why sanctuary scholarships matter so much. Our sanctuary scholarships guide compares the current schemes.
On institutions, the awarded Universities of Sanctuary list had 52 entries when we checked in September 2026. That is a list, not a clean count of universities: Mansfield and Somerville colleges at Oxford are listed separately from the University of Oxford, Warwick appears twice, and a few entries show no award year. The award is an accreditation, and it does not by itself tell you whether a university offers funding.
What does each number actually measure?
Most errors with refugee statistics are not arithmetic mistakes. They are category mistakes: a number that measures one thing quoted as if it measured another. This table sets out the ones we see most often.
| Number | What it measures | Common misreading | Say instead |
|---|---|---|---|
| Refugee gross enrolment rate (e.g. 67% primary) | Everyone enrolled at a level, of any age, divided by the official-age population | “67% of refugee children go to primary school” | “The refugee gross enrolment rate at primary level was 67% in 2024” |
| 117.8 million forcibly displaced | Refugees, asylum-seekers, internally displaced people and others in need of international protection | “117.8 million refugees” | “117.8 million forcibly displaced people, of whom 41.6 million were refugees” |
| 85,891 people claiming asylum | A flow: new claims over 12 months, including dependants | “85,891 asylum seekers in the UK” or “85,891 applications” | “85,891 people claimed asylum in the year ending June 2026” |
| 581,072 refugees in the UK (UNHCR) | A stock: people with refugee or similar status at one date, including Ukrainians | Adding it to annual claims or grants | “UNHCR recorded 581,072 refugees in the UK at the end of 2025” |
| 38% grant rate | Share of initial decisions on main applicants that were grants | “62% of asylum seekers are refused” as a final outcome | “38% of initial decisions were grants; many outcomes change on appeal” |
| 4,275 UASC claims | Claims recorded as from unaccompanied children over a year, UK-wide | “4,275 unaccompanied children in care” | Use DfE’s 6,540 for children looked after in England on 31 March 2025 |
| Year ending June 2026 | July 2025 to June 2026 | Treating it as calendar year 2026 or 2025 | Always write “in the year ending June 2026” |
| UCAS declared applicants | Self-declared status at application, UK-domiciled, rounded | “Refugee students at UK universities” | “UK-domiciled UCAS applicants who declared refugee status” |
| 9% tertiary enrolment | Gross rate across reporting countries, partly boosted by better data | A like-for-like trend line since 2019 | “9% in 2024, up from 1% in 2019, partly due to improved data” |
Beyond the table, three habits prevent most problems.
Name the edition. Official figures are revised. The Migration Observatory’s August 2025 briefing reported that around 108,000 people claimed asylum in 2024; the August 2026 Home Office tables give 104,764 for the same year. Neither is wrong for its edition. Quote the one you used, with its date.
Keep people and cases apart. Home Office “people” figures include dependants; “cases” and the grant rate count main applicants only. The Migration Observatory makes the same distinction between asylum seekers and asylum applications. Mixing the two produces numbers that look close but are not comparable.
Keep flows and stocks apart. Claims, decisions, grants and arrivals are flows over a period. People awaiting a decision, people on asylum support, children looked after and refugees living in a country are stocks on a date. Adding a flow to a stock, or comparing one with the other, almost always gives a misleading answer.
Why these numbers matter to a small charity
Statistics at this scale can make individual effort feel beside the point. We think the opposite is true, because the numbers describe transitions, and transitions happen one person at a time.
The global figures show that the steepest drop comes after secondary school. The UK figures show that most unaccompanied children arrive at 16 or 17, exactly when that transition is due. The UCAS figures show that thousands of young people with refugee status, limited leave or a pending claim are applying to university anyway.
Our own numbers are small, and exact. In 2025, 315 young people applied for 30 places on our free two-week STEM and English summer school at UCL, which covers travel, food and materials. Since 2022 our volunteer mentors have supported 32 students through more than 250 hours of mentoring. Our students have come from 23 countries. We wrote about what that level of demand means in ten times demand in 2025.
Summer School 2026 has finished, and applications for Summer School 2027 will be announced on our application page.
Figures compiled in September 2026 from the sources listed below, using the Home Office release of 27 August 2026, UNHCR’s Global Trends 2025 and Education Report 2025, the DfE children looked after release of November 2025 and UCAS’s 2026 cycle June deadline data. Rules and figures change — if you spot something out of date, please tell us.
Keep reading
- From 1% to 15%: the fight to get refugees into higher education — what sits behind the 15by30 target and where the ladder breaks.
- The GCSE vacuum — why young people who arrive at 15 or 16 fall through UK education.
- Unaccompanied asylum-seeking children and their education rights — what the law says for the 4,275 children behind the headline figure.
- Home fees and student finance for refugees and asylum seekers — how immigration status shapes the cost of university.
Frequently asked questions
How many refugees are there in the world?
UNHCR’s Global Trends report, published in June 2026, counts 41.6 million refugees at the end of 2025. That includes 27 million refugees under UNHCR’s mandate, 1.5 million people in a refugee-like situation, 7.2 million other people in need of international protection and 6 million Palestine refugees under UNRWA’s mandate. UNHCR also counts 9 million asylum-seekers and 68.7 million internally displaced people, and puts the total number of forcibly displaced people at 117.8 million. The rounded component figures do not add up exactly to that total, so quote the total as UNHCR publishes it.
What percentage of refugees go to university?
UNHCR’s 2025 Education Report puts the refugee gross enrolment rate in tertiary education at 9% for the 2024 academic year, up from 1% in 2019. The global target, known as 15by30, is 15% by 2030. For comparison, the world tertiary gross enrolment ratio was about 44% in 2024, according to UNESCO Institute for Statistics data. UNHCR says part of the recent rise reflects better data and tracking.
How many people claimed asylum in the UK in the last year?
Home Office statistics published on 27 August 2026 show that 85,891 people claimed asylum in the UK in the year ending June 2026, 21% fewer than in the previous year. The figure counts main applicants and their dependants. Claims peaked at 109,662 in the year ending September 2025. The next quarterly release is planned for 26 November 2026.
What is the UK asylum grant rate?
The grant rate at initial decision was 38% in the year ending June 2026, down from 48% a year earlier. It is the share of first decisions on main applicants that resulted in protection or other leave, excluding withdrawals. It is not a final success rate: for claims made between 2007 and 2022, the grant rate after appeals and reconsiderations was on average 20 percentage points higher.
How many unaccompanied asylum-seeking children are in the UK?
There are two different counts. The Home Office recorded 4,275 asylum claims from unaccompanied children across the UK in the year ending June 2026. The Department for Education counted 6,540 unaccompanied asylum-seeking children looked after by local authorities in England on 31 March 2025. The first is a yearly flow of new claims; the second is a snapshot of children in care. See our guide to UASC education rights.
Does anyone count refugee students at UK universities?
Not comprehensively. We could not find a published national count of refugees enrolled at UK universities. The best regular indicator is UCAS application data: by the 30 June 2026 deadline, 6,210 UK-domiciled applicants said they had refugee status or humanitarian protection, 800 said they were seeking asylum and 7,800 said they had limited or discretionary leave to remain. These are self-declared applicants, not enrolled students.
How many Universities of Sanctuary are there?
City of Sanctuary’s public list of awarded Universities of Sanctuary had 52 entries when we checked in September 2026. Count with care: two Oxford colleges are listed separately from the university, Warwick appears twice, and a few entries show no award year. The award is an accreditation and does not by itself mean a university offers a scholarship; see our sanctuary scholarships guide.
Sources & further reading
Every third-party figure quoted above links back to its primary source. Where a statistic is our own, it comes from our programme records.
- Global Trends: Forced Displacement in 2025, UNHCR (2026)
- Refugee Data Finder: population statistics and definitions, UNHCR (2026)
- UNHCR Education Report 2025 — The Unbreakable Promise: Resilience and Resolve in Refugee Education, UNHCR (2025)
- Progress in refugee education at risk from funding cuts, UNHCR warns, UNHCR (2025)
- 15by30 Roadmap: Expanding Higher Education, Skills and Self-Reliance for Refugees, UNHCR (2023)
- UNHCR reports progress in refugee education; tertiary enrolment rate hits 7 per cent, UNHCR (2023)
- School enrollment, tertiary (% gross), World Development Indicators (UNESCO Institute for Statistics data), World Bank (2026)
- How many people claim asylum in the UK? Immigration system statistics, year ending June 2026, Home Office, GOV.UK (2026)
- How many people are granted asylum in the UK? Immigration system statistics, year ending June 2026, Home Office, GOV.UK (2026)
- Immigration system statistics data tables (asylum and safe and legal routes summary tables, June 2026), Home Office, GOV.UK (2026)
- Children looked after in England including adoptions, reporting year 2025, Department for Education (2025)
- 2026 cycle applicant figures – 30 June deadline, UCAS (2026)
- Awarded Universities of Sanctuary, City of Sanctuary UK (2026)
- Asylum and refugee resettlement in the UK, Migration Observatory, University of Oxford (2025)
- Bridging the Future programme records, 2018–2025, Bridging the Future
Spotted something out of date, or have a figure we should include? Write to contact@bridgingthefuture.org and we will correct it.